Write simple functional
python code

Investigate and analyse it
as a dataflow pipeline
Integrate it with your
production systems
Write simple functional
python code
Investigate and analyse it
as a dataflow pipeline
Integrate it with your
production systems
Introductory Article
fn_graph Documentation
fn_graph Github
fn_graph_studio Github
Manage your data processing, machine learning, domain or financial logic all in one simple unified framework. Make models that are easy to understand at a meaningful level of abstraction.
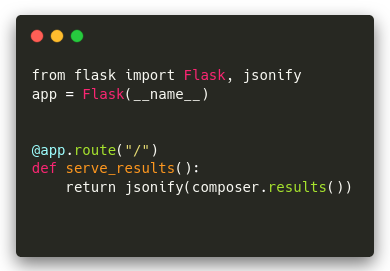
Take the models your data-scientist and analysts build and move them into your production environment, whether thats a task runner, web-application, or an API. No recoding, no wrapping notebook code in massive and opaque functions. When analysts need to make changes they can easily investigate all the models steps.
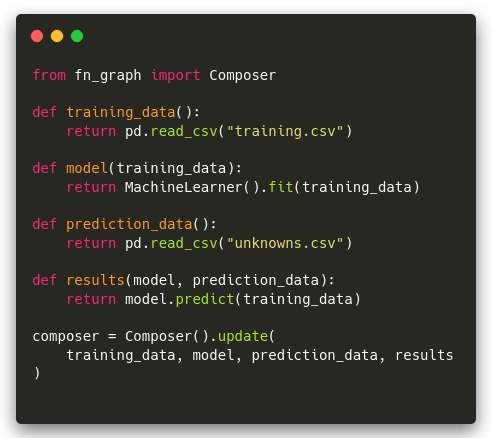
Fn Graph is extremely minimal. Develop your model as plain python functions and it will connect everything together. There is no complex object model to learn or heavy weight framework code to manage.
Easily navigate and investigate your models with the visual fn_graph_studio. Share knowledge amongst your team and with all stakeholders. Quickly isolate interesting results or problematic errors. Visually display your results with any popular plotting libraries.
Use fn_graph as a complement to your notebooks, or use it with your standard development tools, or both.
fn_graph makes no assumptions about what libraries you use. Use your favorite machine learning libraries like, scikit-learn, PyTorch. Prepare your data with Pandas or Numpy. Crunch big data with PySpark or Beam. Plot results with matplotlib, seaborn or Plotly. Use statistical routines from Scipy or your favourite financial libraries. Or just use plain old Python, it's up to you.
Integrated and intelligent caching improves modelling development iteration time, a simple profiler works at a level that's meaningful to your model.
The composable pipelines allow for easy model reuse, as well as building up models from simpler submodels. Easily collaborate in teams to build models to any level of complexity, while keeping the individual components easy to understand and well encapsulated.
It's just plain Python! Use all your existing knowledge, everything will work as expected. Integrate with any existing python codebases. Use it with any other framework, there are no restrictions.

A simple machine learning example that builds a classifier for the standard iris dataset.
This example uses scikit-learn to build a a classifier to detect the species of an iris flower based on attributes of the flower. Based on the parameters different types of models can be trained, and preprocessing can be turned on and off. It also show cases the integration of visualisations to measure the accuracy of the model.
Studio Source
A credit model that uses a machine learning model to estimate the expected value of the the remaining loans in a loan book.
The example shows how to integrate a machine learning model with some simple domain information to get contextualized result. It also show cases how statistical libraries like Seaborn can be used to investigate data before hand.
Studio Source
In finance, the Sharpe ratio (also known as the Sharpe index, the Sharpe measure, and the reward-to-variability ratio) measures the performance of an investment (e.g., a security or portfolio) compared to a risk-free asset, after adjusting for its risk. It is defined as the difference between the returns of the investment and the risk-free return, divided by the standard deviation of the investment (i.e., its volatility). It represents the additional amount of return that an investor receives per unit of increase in risk.
This shows how to calculate a the Sharoe ratio for a small portfolio of shares. The share data us pulled from yahoo finance and the analysis is done in pandas. We assume a risk free rate of zero.
Studio Source